Where are Those “Top 10” Companies Now? – “2010” Focus
“Top” companies can seemingly do no wrong during their ascent. Whether filtered by top US companies by market cap or fastest growing over the last decade, these companies tend to be household names with a ton of caché. Right now, the top US company by market cap is Apple (AAPL). The fastest growing for the last decade (2010s) is Netflix (NFLX). Some of the luster has already caught up to Netflix as competitors have filled the gap. Apple, though, still seems to dominate. Will that be the case in five years? 10 years? When a fifty-something is ready to retire and dip into their nest-egg?
The only sure thing in investing is uncertainty, but maybe we can learn something from history. How have the “Apples” and “Netflixes” of the past performed over time? Today, let’s look back to 2010 and see if there are any important lessons for investors.
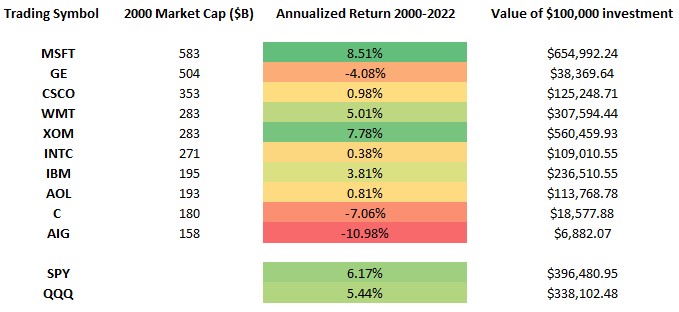
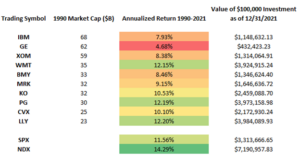
Below is a list of the ten largest companies by market capitalization as of 1/4/2010, and their performance since. These return numbers include dividend reinvestment and consider a hypothetical $100,000 investment in each security using closing prices on 12/31/2009. The ending value is as of 12/31/2022. We’ve also provided information on the results of the SPDR S&P 500 ETF Trust (SPY), representing large-cap US equities, and the Invesco QQQ Trust (QQQ), an ETF with holdings of mostly large-cap stocks from the Nasdaq 100, during the same period. The performance shown in this table is for illustrative purposes only and is not intended to represent the performance of Exceed Advisory or any of its clients.
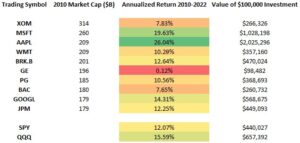
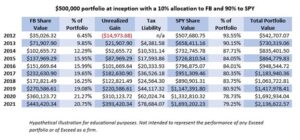
The hypothetical performance shown in the table above is for illustrative purposes only and is not intended to represent the performance of any Exceed Advisory portfolio or of Exceed as a firm.
This decade was a great time to be invested in equities, as the economy was recovering from the Great Financial Crisis with the aid of quantitative easing and historically low interest rates. Most of the damage from 2008-2009 was repaired in a matter of a couple years, and the era of dominance by technology stocks was underway. Despite this backdrop and a raging bull market, investments in only a small percentage of these companies would’ve yielded superior performance to a passive index investment – only AAPL and MSFT were the outliers. Investments in GOOGL, BRK.B or JPM would’ve resulted in performance similar to that of their respective indices, while the remaining five companies on this list significantly underperformed the broad market. In a previous blog we looked at the bear-market period from 2000-2010 and it showed that being diversified was critical for loss mitigation and volatility reduction. This has also held true during strong bull markets – very few investors are able to pick stocks that are long-term outperformers, and from the list above there was only a 20 percent chance that an investment in any of these names would’ve resulted in material outperformance. Choosing to hold a concentrated portfolio raises its risk profile, which in turn increases the potential for underperformance versus a diversified market portfolio.
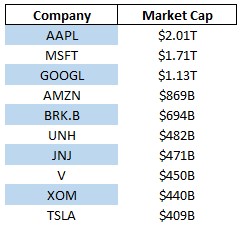
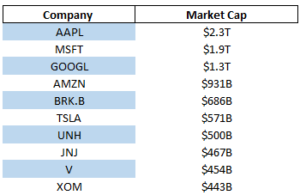
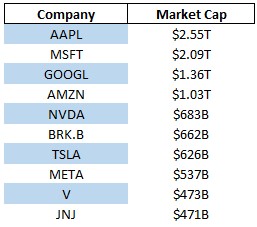
Below is the current list of the ten largest U.S. corporations. We will continue to look at different slices of time in future blogs as we did above, but the theme remains consistent – historically, most of the biggest companies have underperformed the broad market over long periods of time. It seems unfathomable that any of these companies could be poor investments going forward, but history suggests otherwise. That said, it’s also true that past performance isn’t a guarantee of future results, so we don’t know for sure what the future will bring. We do, though, think caution is warranted when assuming that today’s top performers will continue to be tomorrow’s top performers.
The solution to combat a concentrated portfolio of mega-cap stocks is simply to reduce position sizes and rebalance into a diversified market portfolio. Multiple studies have shown that concentrated portfolios often underperform over long time periods, and the optimal portfolio decision is to rebalance and reduce volatility and exposure. 1Nathan Sosner, “When Fortune Doesn’t Favor the Bold. Perils of Volatility for Wealth Growth and Preservation. The Journal of Wealth Management Winter 2022, jwm.2022.1.189; DOI: https://doi.org/10.3905/jwm.2022.1.189 2Baird’s Private Wealth Management Research, “The Hidden Cost of Holding a Concentrated Position. Why diversification can help to protect wealth.” https://www.bairdwealth.com/siteassets/pdfs/hidden-cost-holding-concentrated-position.pdf If you or your clients have concentrated positions with significant tax liability in any of the above companies, Exceed Investments can help. Exceed’s tools can be implemented to hedge large investments, and in many cases reduce them to a desired level without having to pay capital gains tax. Contact us for a consultation.
IMPORTANT DISCLOSURE: The information in this blog is intended to be educational and does not constitute investment advice. Exceed Advisory offers investment advice only after entering into an advisory agreement and only after obtaining detailed information about the client’s individual needs and objectives. Hedging does not prevent all losses or guarantee positive returns. Transaction costs and advisory fees apply to all solutions implemented through Exceed.