• Skip to primary navigation
  • Skip to main content
  • Skip to footer
Exceed Investments

Exceed Investments

Let us be your Options Expert

  • Why Exceed
  • Strategy Spotlight
  • Who We Are
  • Blog
  • Contact
  • Login

options

Nervous About Your NVDA Gains? A Solution to Both Protect and Participate with No Cash Outlay

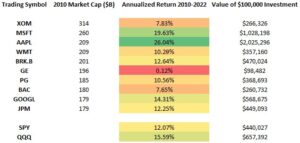
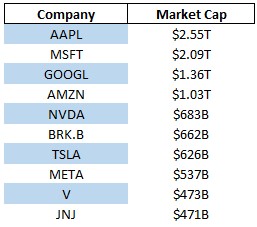
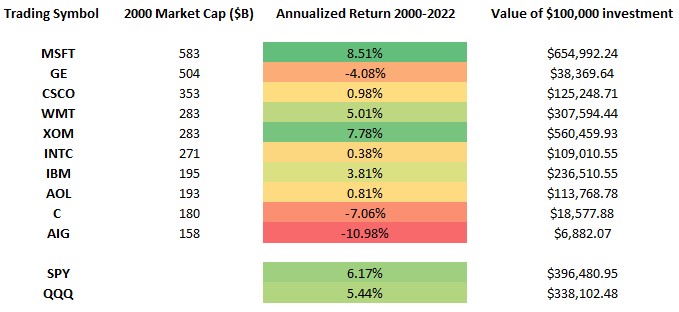
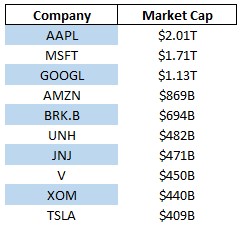
NVDA has been one of the biggest beneficiaries of the recent AI craze, as the company has added 90% to its market capitalization year-to-date and a staggering 251% year-over-year. It’s now the third-largest company in the world with a market cap of about $2.4T, trailing only AAPL ($2.6T) and MSFT ($3.2T). If you or a client have been fortunate enough to ride this rally, you’re likely very pleased by the recent performance but also potentially have excess exposure to shares of this single, volatile company. As we’ve discussed in previous blogs, companies with the highest market capitalization have historically underperformed broad-market indices over longer timeframes. 1https://exceedinvestments.com/where-are-those-top-10-companies-now-nineties-focus/ 2https://exceedinvestments.com/where-are-those-top-10-companies-now-millennium-focus/ 3https://exceedinvestments.com/where-are-those-top-10-companies-now-2010-focus/ This isn’t to say that NVDA is going to underperform the broad market going forward, but history has shown that the upside outliers are scarce.

As a shareholder of a now-concentrated NVDA position, an investor faces the tradeoff of holding a portfolio with elevated embedded volatility that is exposed to greater downside risk versus selling a portion of their NVDA holding to diversify into a balanced market portfolio. However, rebalancing out of a highly-appreciated stock will likely come at the cost of a big tax bill. Thankfully, there is a solution using options that allows investors to hedge downside risk while also participating in significant potential share appreciation, and greatly reducing volatility while deferring and seeking to minimize capital gains taxes.

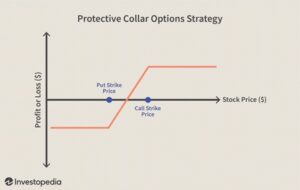
A collar is an option overlay strategy that involves selling an upside call against an existing stock position and using the proceeds from that sale to purchase protective puts that limit downside to a predefined level. A “zero-cost collar” is one of the more popular option strategies and involves matching the premium collected from the sale of the call to the cost of purchasing puts, thus requiring no or very little cash outlay, inclusive of the cost of executing the trade. There is an implicit cost of potential foregone upside in the event the stock rallies above the sold call option strike, but collars can even be structured as a net credit to the investor if so desired, resulting in a cash inflow.


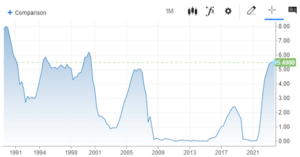
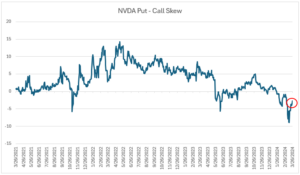
Option prices are dynamic and are partially driven by demand for bullish exposure (calls) versus bearish exposure (puts). When stocks rally sharply, calls are generally more “expensive” relative to puts because of excess investor demand to buy those calls and place bullish bets on continued appreciation. Contrarily when stocks sell off sharply, investor sentiment can shift dramatically and drive excess demand for put options. This is known as skew and is a common metric followed closely by option traders. The recent sharp rally in NVDA has driven call prices significantly higher than puts, creating the potential to use a collar overlay on an NVDA stock position very efficiently. At this point in time, you can sell very “expensive” calls and buy relatively “cheap” put options, maximizing the tradeoff between potential upside appreciation and downside protection via option collars. The chart below depicts the difference in implied volatility of calls versus puts, with the difference in implied volatility of 25-delta (out of the money) options plotted on the Y-axis. When the reading is positive, puts are relatively more expensive than calls, and when the reading is negative calls are more expensive than puts. The put-call skew reading hit an extreme low a couple weeks back, indicating that calls were at their most expensive level relative to puts at any point over the past three years. While this extremely low reading has reverted somewhat higher since then, the current level remains well below long-term averages.


NVDA closed at 925.61 on 3/26, and the options market has a volatility expectation of +/- 43.4% for NVDA shares between now and June 20, 2025, 450 days from today.4Using the midpoint of 6/20/25 option prices as of the market close on 3/26/24 for an at-the-money straddle This means that the options market is currently pricing NVDA to close within a range either 43.4% higher or lower from here, or between about 524 and 1327 by 6/20/25. Options can often be wrong about the realized volatility over a period, but we like to use this as a baseline expectation of outcomes over a certain timeframe to give a general idea how to best structure these trades.

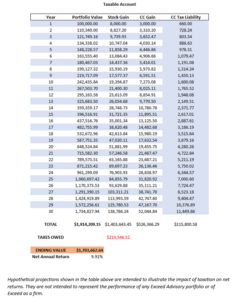
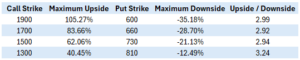
Assuming the options market is correct about its volatility expectation, you can currently sell the 6/20/25 1340-strike call on NVDA for about $110 per contract and buy the 790-strike put for about the same price. What this means is that a holder of an NVDA stock position with this collar overlay can fully participate in 44.8% share upside between now and 6/20/25, while limiting downside risk to a maximum of 14.7%. Perhaps the investor would like a little more upside potential and less downside protection or vice versa – below is a list of currently available collars that can be implemented at close to zero cash outlay. These strategies are fully customizable, so the NVDA holder can choose exactly how much potential upside or downside protection they desire and structure the trade accordingly. As you can see, the potential upside is generally a multiple of maximum downside by about a factor of 3 – this is a result of the excessive skew in NVDA call options that currently exists.


Options trading is nuanced and complex, with the opportunities that exist largely a product of the market environment. Recent trends in NVDA options have created what we view as a compelling opportunity for an investor currently sitting on a concentrated NVDA position. This collar overlay will significantly reduce volatility, allow the holder to still participate in some level of potential appreciation, and defer having to rebalance the portfolio and pay capital gains taxes. Contact us for a consultation as to how you can use the recent developments in the NVDA options market to your advantage.


IMPORTANT DISCLOSURE: The information in this blog is intended to be educational and does not constitute investment advice. Exceed Advisory offers investment advice only after entering into an advisory agreement and only after obtaining detailed information about the client’s individual needs and objectives. No strategy can prevent all losses or guarantee positive returns. Options trading involves risk and does not guarantee any specific return or provide a guarantee against loss. Clients must be approved for options trading at the custodian holding their assets, and not all retirement accounts are permitted to trade options. Transaction costs and advisory fees apply to all solutions implemented through Exceed and will reduce returns.


The Effect of Rising Interest Rates on Option Strategies

In 1973, economists Fischer Black and Myron Scholes published “The Pricing of Options and Corporate Liabilities,” which was the birth of the modern option pricing model that is still today’s gold standard for valuation. The formula isn’t perfect and has some limitations, but for the most part it’s withstood the test of time. We’re not going to get too into the weeds with the complex mathematical formula that they created, but if you want to learn more about it you can here.


What’s important to glean from the Black-Scholes Model are the factors that have a first-order effect on option prices and the extent of how changes in those inputs alter the underlying option price. There are 5 basic inputs that determine the price of an option:

  1. Underlying Asset Price – The price of the stock, index, or ETF. Higher-priced assets generally have higher option prices on a dollar basis (but not a percentage basis).
  2. Implied volatility – The market’s expectation of the future volatility of this asset1Not to be confused with historical volatility, which measures how volatile a security has been in the past. Many people use a combination of historical volatility, upcoming known events, and general market activity to triangulate a reasonable implied volatility estimate. . Higher expected volatility leads to higher option premiums and vice versa.
  3. Time to Expiration – The greater the time to expiration, the higher the theoretical price of an option (wider range of outcomes over longer timeframes), all else equal.
  4. Option Strike Price – The price at which the security can be purchased (call option) or sold (put option) by the option holder prior to or at the maturity date (expiration date)2We are assuming a US readership. “American” options can always have their right exercised while “European” options can only be exercised at maturity..
  5. The current Risk-Free Interest Rate3Dividends are incorporated into this rate – risk-free interest + dividend yield creates an effective forward rate for an underlying security. A hard to borrow security would result in a higher borrowing cost, which would affect the forward rate. This cost is also incorporated into the “rate” component of the formula. – Theoretical rate of return that an investor would expect on an investment with zero risk. The proxy for this rate is the yield of a Three-Month U.S. Treasury Bill.


Many option traders are very familiar with 1-4 on this list, but the interest rate component is oftentimes ignored. It’s no secret that rates have risen dramatically over the past two years, especially at the short end of the curve.  The graph below depicts the 3-month U.S. Treasury Yield going back to 1990. The rate of ascent from the bottom in rates in early 2022 to present day is the fastest ever, and the current yield of 5.49% is near its highest level over the past 23 years.


All else equal, a higher risk-free interest rate leads to higher call option prices and lower put option prices.  Buying options is a way to get leverage and requires less initial investment than owning or shorting shares, though an option buyer must recognize the risk that they may lose all their investment if the underlying security is not above the call strike or below the put strike on the day of maturity. An investor can purchase call options instead of shares to express a bullish view and then use the difference in capital required to invest elsewhere. With interest rates much higher now than they were in early 2022, the opportunity cost of buying shares has increased. Money that would be tied up owning stock can now be invested “risk free” at more than a 5% return. We see the opposite of this phenomenon with put options – traders can buy put options to express a bearish view instead of shorting shares, but shorting stock becomes more profitable as interest rates increase. When you short a stock, the broker will pay interest on the cash that the short sale generated. Since the potential interest earnings are now much higher than before, put options become less valuable.


Let’s look at a hypothetical situation involving stock XYZ. We’ll assume that (1) the stock is $100 per share, (2) the strike price of both the call and put option are 100(at the money), (3) the options expire in 90 days, (4) the company doesn’t pay dividends, and (5) the volatility of XYZ shares is 20%. The risk-free rate in January 2022 was around 0.053%, so we’ll use that as a baseline.  Given those inputs, the theoretical call price is 3.97 and the put is 3.95.


Now let’s assume that nothing has changed except it’s now 10/31/23 and the risk-free rate is 5.49%. Using those inputs, the theoretical call price becomes 4.65 and the put is 3.41 – a 17% increase in the call option price and nearly a 14% decline in the value of the same put option!


Let’s take this a step further and look at out-of-the-money options, which are more rate sensitive than at-the-money options. Using the same assumptions as before and looking at 10% and 20% out-of-the-money options instead of at-the-money options, the changes in the option prices were staggering. The theoretical price of the 10% out-of-the money call rose by 27% and the 20% out-of-the money call rose by 39% merely from the difference in the risk-free rate between January 2022 and now.  Additionally, the price of 10% out-of-the-money put option declined by 23%, and the 20% out-of-the-money put saw a theoretical drop of 34% by adjusting only one variable. All else equal, the farther out of the money an option is, the more its value is affected by changes in interest rates.


Investors can capitalize on these recent market trends and use them to their advantage. It may not make as much sense now as it did in January 2022 to buy a call option (for multiple reasons), but you can flip that dynamic and use the elevated premiums to write covered calls and generate additional income on your stock holdings. With lower relative put premiums now than in 2022, hedging stock positions via buying puts or collars may be more logical now than before.


Options trading is nuanced and complex, with the opportunities that exist largely a product of the market environment. The dramatic spike in interest rates over the past couple years has changed the landscape and creates the potential for higher income generation and lower hedging costs now than before. Contact us for a consultation as to how you can use these developments to your benefit.


IMPORTANT DISCLOSURE: The information in this blog is intended to be educational and does not constitute investment advice. Exceed Advisory offers investment advice only after entering into an advisory agreement and only after obtaining detailed information about the client’s individual needs and objectives. No strategy can prevent all losses or guarantee positive returns. Options trading involves risk and does not guarantee any specific return or provide a guarantee against loss. Clients must be approved for options trading at the custodian holding their assets, and not all retirement accounts are permitted to trade options. Transaction costs and advisory fees apply to all solutions implemented through Exceed and will reduce returns.

The Power of Using Options in Retirement Accounts

At first glance, you might be thinking I’m insane to even be mentioning options and retirement accounts in the same breath. After all, options are meant for rampant speculation and are super risky, right? While they can be used for “gambling” purposes if so desired, options are flexible instruments that have a wide variety of uses and benefits, even in qualified retirement accounts such as an IRA.

The main benefit of investing in an IRA is that taxes are either deferred until the money is withdrawn (traditional IRA), or the account can be funded with after-tax dollars and grow over time without accruing any tax liability (Roth IRA). I won’t get into the details too much here, but Roth IRAs generally aren’t available to high-income households, though there are some workarounds. What’s important to note is the potential power of tax deferral and the effect that it can have on a retirement portfolio. This benefit is amplified when using an income-generating strategy such as writing covered calls against existing stock holdings.

Consider a hypothetical portfolio of $100,000 that’s fully invested in equities. Let’s assume, to illustrate the math, that this portfolio returns 8% every year for 30 years, there are no annual contributions, and the investor implements a covered-call overlay strategy that generates an additional 3% annually in yield. The yield-generating potential of each portfolio depends on the volatility of its holdings, but we think 3% annual yield via covered calls is a conservative assumption. We’ll also assume that this investor is married and sits in the 22% tax bracket, which indicates a total household income range of $89,450 to $190,750 for 2023. For simplicity’s sake, we’ll also assume that no stock holdings are sold at any point until the end of this 30-year period. Lots of unrealistic assumptions here-especially the lack of volatility, which is obviously significant in the real world-but the simplicity helps make the point about the effect of taxes, since that’s the only factor that differs in the three scenarios shown.  Here’s what the growth of this hypothetical portfolio would look like over time. The “Portfolio value” column is a beginning of year number.

Profits from covered calls are taxed as capital gains, and in this example the tax rate is 22%. This tax liability is subtracted from the portfolio value every year and is a drag on the effects of compounding. The stock gain at the end of this 30-year period is taxed at 15%, the long-term capital gains rate for married couples earning $89,251-$553,850 annually. While this hypothetical investor accumulated significant wealth over this period, the taxes due each year from the covered-call returns were a drag on total returns.

Now let’s look at the numbers had this $100,000 originally been held in a traditional IRA. The assumptions remain the same as the example above in the taxable account, but the tax treatment is different. In a traditional IRA, all taxes owed are deferred until retirement, which we’re assuming is in 30 years. The tax rate on all gains in a traditional IRA is the income tax bracket that the investor resides in, which in this case is 22%. Both the stock and dividend profits will be taxed at 22%, but not until the end of this thirty-year period.

The deferred tax treatment in this case led to an additional net return of 0.22% annually. While this doesn’t seem like much on the surface, this can be significant over 30 years. In this example, that equated to an additional $103,936 in portfolio value! This amount would be even greater over a longer time horizon, or if the assumed returns were higher.

Lastly, let’s look at the numbers if this hypothetical portfolio was in a Roth IRA. Roth IRAs allow for all gains to grow tax free. The drawback to Roths is that there are annual contribution limits, income requirements, and if you roll an existing retirement account into a Roth IRA, you’ll likely owe income taxes on that money at inception. Most retirement accounts are funded with pretax dollars whereas a Roth IRA is funded with post-tax dollars. However, once this one-time tax is paid, you’ll never have to pay another penny in taxes on that account, assuming the appropriate rules are followed.

As you can see, the effect of not having to pay annual or terminal taxes on this account is substantial. An additional 0.87% net return annually (via tax savings) from a Roth IRA versus a traditional IRA equated to $481,631 more in portfolio value at the end of this period. This is a great example of how being tax savvy at the margin can have a dramatic effect on wealth as time goes on.

Retirement accounts aren’t generally where you see option activity, but small return enhancements over time can really add up. Using a covered-call overlay strategy inside of a tax-advantaged account can reduce volatility, potentially increase returns on both an absolute and risk-adjusted basis, and have a significant effect on retirement wealth.


IMPORTANT DISCLOSURE: The information in this blog is intended to be educational and does not constitute investment advice. Exceed Advisory offers investment advice only after entering into an advisory agreement and only after obtaining detailed information about the client’s individual needs and objectives. No strategy can prevent all losses or guarantee positive returns. Options trading involves risk and does not guarantee any specific return or provide a guarantee against loss. Clients must be approved for options trading at the custodian holding their assets, and not all retirement accounts are permitted to trade options. Transaction costs and advisory fees apply to all solutions implemented through Exceed and will reduce returns.

How to Use Options to Invest Like Warren Buffett

Warren Buffett is undoubtedly one the most famous and successful investors of all time, yet his strategy is very simple and straightforward – invest in companies that have solid fundamentals, a stable and growing business, and pay dividends. A dividend is simply a portion of the company’s earnings (or in some cases, reserves) that they choose to pay to investors instead of reinvesting in the company. While it’s not guaranteed to always be a set amount or paid in perpetuity, a dividend generates returns for investors even when the price of the company’s stock fails to appreciate. This creates a built-in buffer against volatility and allows the investor to either purchase more shares of the company with this recurring income or simply pocket the payments for use elsewhere. The amount of cash generated via dividends by Buffett’s Berkshire Hathaway is staggering and continues to increase. In 2022 alone, the company received over $6B in dividend payments from its equity holdings.

Recent market trends have many investors reaching for yield, and allocations to dividend-generating investments have exploded in the past year. Two of the more popular vehicles for income-based ETF investing are the JPMorgan Equity Premium Income ETF (JEPI) and The Amplify CWP Enhanced Dividend Income ETF (DIVO) by Capital Wealth. Both instruments employ an active management strategy where the fund holds a portfolio of mature dividend-paying companies and then overlays a covered call strategy against the stock positions. The use of covered calls limits upside for each equity holding over a specified timeframe, but in return the fund receives a steady stream of payments via option premium. This income stream decreases volatility and potentially enhances returns on both an absolute and risk-adjusted basis.  These strategies may work well if you are comfortable with the respective ETF managers selecting the underlying securities – if you prefer to select your own exposure and have a specialty manager assist in a covered call overlay, a firm like Exceed can help in the portfolio construction and management via an SMA.


Increase in Assets Under Management Over the Last Year


                                        courtesy of YCharts


The top stock holdings in income-based ETFs generally include companies like VZ, PG, UNH, HSY, PEP, and V. These are considered value investments with businesses that are mature, have stocks that trade at or below average market volatility, and for the most part are growing revenue at modest rates.  As a result of these companies’ strong position in the market, management has chosen to return a portion of its profits to investors instead of reinvesting in company-specific ventures. Investing in a diversified portfolio of these types of companies is typically relatively safe and suitable for those with a lower risk tolerance, but potential future upside is expected to be limited when compared to smaller growth or technology companies. Income-based ETFs are often good choices for those close to retirement age, but they’re not for everyone.

Many active investors have an affinity for companies with big growth potential and stocks that trade above average market volatility levels.  The tradeoff to investing in growth stocks like TSLA, NVDA, and PLTR is that very few of them pay a dividend – a holder of one of these companies is forfeiting a stream of regular dividend payments for the prospect of excess future returns. While “value” stocks tend to have lower volatility and higher dividends, growth stocks have the opposite – low dividends and higher volatility. Option prices are a function of volatility, with higher volatility driving higher option prices and premiums. As a result, you can generate higher yield writing covered calls on growth names versus value investments. While a practitioner of this strategy may be giving up some upside at times, at other times they will be rewarded handsomely for doing so. Everything else being equal, holding a stock with above average volatility and tactically writing covered calls against it creates the potential for both significant price appreciation and yield generation.

Options offer strategic advantages in different market environments, and many professional investors use them to their advantage on a regular basis – even Warren Buffett, king of buy-and-hold value investing, uses them as part of his strategy.  Selling covered calls can significantly enhance total portfolio returns, but structuring and managing these strategies can be tedious and complex. The team at Exceed Advisory has over 40 years of collective professional options experience and can simplify the process for you and your clients. Contact us for a consultation as to how you can use options as an overlay to an existing model portfolio to create your own dividend stream.


IMPORTANT DISCLOSURE: The information in this blog is intended to be educational and does not constitute investment advice. Exceed Advisory offers investment advice only after entering into an advisory agreement and only after obtaining detailed information about the client’s individual needs and objectives. Hedging does not prevent all losses or guarantee positive returns. Options trading involves risk and does not guarantee any specific return or provide a guarantee against loss. Clients must be approved for options trading at the custodian holding their assets. Transaction costs and advisory fees apply to all solutions implemented through Exceed and will reduce returns.


* JEPI and DIVO are not affiliated with or recommended by Exceed Advisory. We are using these two popular ETFs solely to illustrate how a general market strategy that may effectively serve retail investors at relatively low cost differs from Exceed’s approach. Exceed’s options overlay advice is tailored to the specific holdings of the client and will generally result in higher investment costs than a pooled mass-market solution, such as an ETF.


Top 3 Ways to Incorporate Options Into Your Practice

Options are broadly misunderstood and underutilized as tools in many wealth management practices. Most retail investors and even many advisors have an immediate negative reaction to just hearing the word “Options.”  Many investors simply think of the options market as a personal casino with the potential to win and lose fortunes. We’ve all heard horror stories about a friend or colleague who took a big risk on an option position and lost it all – but it is so much more than that.  What many fail to realize is that options are extremely flexible instruments that can be used to create an income stream, dampen volatility, and even reduce or eliminate capital gains tax liability.  When used properly, options can provide significant benefits to wealth managers and their clients.

Equity markets have struggled for the past year and a half as inflation concerns, geopolitical issues, and recession fears continue to dominate the headlines. This environment has many investors looking for new ways to produce returns. One method to generate diversified yield is to sell covered calls against core stock holdings. Someone who writes (sells) calls against their stock position is limiting their upside over a specified timeframe but receives payment in the form of option premium for doing so.  Practitioners of this strategy will generally sell calls at or above a price level that they deem unlikely to be seen over the life of the option. This allows the stockholder to still participate in share price appreciation, while also generating an income stream and lowering volatility.

Options are widely used by institutional investors for hedging their exposure but are largely overlooked by financial advisors and retail investors for that same purpose. While hedging may be unsuitable for some investors, it can make a lot of sense for those who have reduced risk tolerance. If an advisor has a client concerned about a specific position or the market in general, a simple hedge using options can be used to de-risk the position and help everyone rest easy at night.  Using options offers a great deal of flexibility as to how the hedge can be structured, and oftentimes this can be done at little or no cost with collars. These strategies aren’t for everyone. There are transaction costs involved—which are often higher for options than for other securities. Similarly, hedging trades can erode profits on positions that continue to appreciate, and the option contract itself is a wasting asset.

Arguably the most valuable yet least used application of options is for tax optimization within a portfolio. Many buy-and-hold investors find themselves in the position of being heavily exposed to one or a few companies. Assume a hypothetical investor purchased a sizeable position in a stock like AAPL, NFLX, or MSFT many years ago and has never rebalanced their portfolio to avoid paying capital gains taxes. These holdings are likely now a large percentage of their investable wealth and create the potential for excess volatility and large losses. Option overlays can be used to combat this concentrated stock risk and potentially eliminate capital gains tax liability over time. These strategies can be structured to meet the exact goals of each client without being a drain on liquidity.

Options offer a wide variety of benefits to an advisory practice but are generally overlooked because of their complexity and attention required. In addition to this, there are a very specific set of rules that must be followed to realize their potential tax benefit. The team at Exceed Advisory has over 40 years of professional derivatives experience and can help simplify this process and add value for your clients.


Contact us for a consultation


IMPORTANT DISCLOSURE: The information in this blog is intended to be educational and does not constitute investment advice. Exceed Advisory offers investment advice only after entering into an advisory agreement and only after obtaining detailed information about the client’s individual needs and objectives. Hedging does not prevent all losses or guarantee positive returns. Transaction costs and advisory fees apply to all solutions implemented through Exceed.

Where are Those “Top 10” Companies Now? – “2010” Focus

“Top” companies can seemingly do no wrong during their ascent. Whether filtered by top US companies by market cap or fastest growing over the last decade, these companies tend to be household names with a ton of caché. Right now, the top US company by market cap is Apple (AAPL). The fastest growing for the last decade (2010s) is Netflix (NFLX). Some of the luster has already caught up to Netflix as competitors have filled the gap. Apple, though, still seems to dominate. Will that be the case in five years? 10 years? When a fifty-something is ready to retire and dip into their nest-egg?

The only sure thing in investing is uncertainty, but maybe we can learn something from history. How have the “Apples” and “Netflixes” of the past performed over time? Today, let’s look back to 2010 and see if there are any important lessons for investors.

Below is a list of the ten largest companies by market capitalization as of 1/4/2010, and their performance since. These return numbers include dividend reinvestment and consider a hypothetical $100,000 investment in each security using closing prices on 12/31/2009. The ending value is as of 12/31/2022. We’ve also provided information on the results of the SPDR S&P 500 ETF Trust (SPY), representing large-cap US equities, and the Invesco QQQ Trust (QQQ), an ETF with holdings of mostly large-cap stocks from the Nasdaq 100, during the same period. The performance shown in this table is for illustrative purposes only and is not intended to represent the performance of Exceed Advisory or any of its clients.

The hypothetical performance shown in the table above is for illustrative purposes only and is not intended to represent the performance of any Exceed Advisory portfolio or of Exceed as a firm.


This decade was a great time to be invested in equities, as the economy was recovering from the Great Financial Crisis with the aid of quantitative easing and historically low interest rates.  Most of the damage from 2008-2009 was repaired in a matter of a couple years, and the era of dominance by technology stocks was underway. Despite this backdrop and a raging bull market, investments in only a small percentage of these companies would’ve yielded superior performance to a passive index investment – only AAPL and MSFT were the outliers.  Investments in GOOGL, BRK.B or JPM would’ve resulted in performance similar to that of their respective indices, while the remaining five companies on this list significantly underperformed the broad market.  In a previous blog we looked at the bear-market period from 2000-2010 and it showed that being diversified was critical for loss mitigation and volatility reduction. This has also held true during strong bull markets – very few investors are able to pick stocks that are long-term outperformers, and from the list above there was only a 20 percent chance that an investment in any of these names would’ve resulted in material outperformance. Choosing to hold a concentrated portfolio raises its risk profile, which in turn increases the potential for underperformance versus a diversified market portfolio.

Below is the current list of the ten largest U.S. corporations. We will continue to look at different slices of time in future blogs as we did above, but the theme remains consistent – historically, most of the biggest companies have underperformed the broad market over long periods of time.  It seems unfathomable that any of these companies could be poor investments going forward, but history suggests otherwise. That said, it’s also true that past performance isn’t a guarantee of future results, so we don’t know for sure what the future will bring. We do, though, think caution is warranted when assuming that today’s top performers will continue to be tomorrow’s top performers.

The solution to combat a concentrated portfolio of mega-cap stocks is simply to reduce position sizes and rebalance into a diversified market portfolio.  Multiple studies have shown that concentrated portfolios often underperform over long time periods, and the optimal portfolio decision is to rebalance and reduce volatility and exposure. 1Nathan Sosner, “When Fortune Doesn’t Favor the Bold. Perils of Volatility for Wealth Growth and Preservation. The Journal of Wealth Management Winter 2022, jwm.2022.1.189; DOI: https://doi.org/10.3905/jwm.2022.1.189 2Baird’s Private Wealth Management Research, “The Hidden Cost of Holding a Concentrated Position. Why diversification can help to protect wealth.” https://www.bairdwealth.com/siteassets/pdfs/hidden-cost-holding-concentrated-position.pdf  If you or your clients have concentrated positions with significant tax liability in any of the above companies, Exceed Investments can help. Exceed’s tools can be implemented to hedge large investments, and in many cases reduce them to a desired level without having to pay capital gains tax.  Contact us for a consultation.


IMPORTANT DISCLOSURE: The information in this blog is intended to be educational and does not constitute investment advice. Exceed Advisory offers investment advice only after entering into an advisory agreement and only after obtaining detailed information about the client’s individual needs and objectives. Hedging does not prevent all losses or guarantee positive returns. Transaction costs and advisory fees apply to all solutions implemented through Exceed.

Where Are Those “Top 10” Companies Now? – “Millennium” Focus

“Top” companies can seemingly do no wrong during their ascent. Whether filtered by top US companies by market cap or fastest growing over the last decade, these companies tend to be household names with a ton of caché. Right now, the top US company by market cap is Apple (AAPL). The fastest growing for the last decade (2010s) is Netflix (NFLX). Some of the luster has already caught up to Netflix as competitors have filled the gap. Apple, though, still seems to dominate. Will that be the case in five years? 10 years? When a fifty-something is ready to retire and dip into their nest-egg?

The only sure thing in investing is uncertainty, but maybe we can learn something from history. How have the “Apples” and “Netflixes” of the past performed over time? Today, let’s look back to 2000 and see if there are any important lessons for investors.

Below is a list of the ten largest companies by market capitalization as of the start of 20001As of the close of trading on 12/31/1999, and their performance since. These return numbers include dividend reinvestment and consider a hypothetical $100,000 investment in each security on the close of trading for 19992As of the close of trading on 12/31/1999. The ending value is as of 12/31/2022. We’ve also provided information on the results of the SPDR S&P 500 ETF Trust (SPY), representing large-cap US equities, and the Invesco QQQ Trust (QQQ), an ETF with holdings of mostly large-cap stocks from the Nasdaq 100, during the same period. While it’s not possible to invest directly in an index, index returns are widely used to reflect the performance of “markets” overall.


The hypothetical performance shown in the table above is for illustrative purposes only and is not intended to represent the performance of any Exceed Advisory portfolio or of Exceed as a firm.


This decade was an especially difficult time in markets, as the tech bubble burst in 2000 and led to a catastrophic selloff in equities over the next two years.  Markets recovered and recouped most of the losses from the tech bubble over the subsequent five years, but that rally led right into the financial crisis of 2008. Stocks fell precipitously once again before bottoming in early 2009, but this period was essentially a lost decade for investors. It’s evident from the table above that this era of investing was fraught with risk, as even the most established companies weren’t insulated from the crisis. Of the 10 largest companies by market capitalization in 2000, only investments in MSFT and XOM would’ve yielded returns in excess of market indices.  Of the other 8 companies on this list that underperformed the broad market, only two generated dollar returns of at least half of that of a similar investment in SPY.  Investments in three of these companies (AIG, C, and GE) would’ve resulted in significant capital losses over this twenty-two-year period.  Market crises create the potential for big losses in individual names, and this period was no exception. It’s especially important to have a diversified portfolio during such times, and history will likely repeat itself in the future on a long enough timeframe.

Below is the current list of the ten largest U.S. corporations. We will continue to look at different slices of time in future blogs as we did above, but the theme remains consistent – historically, most of the biggest companies have underperformed the broad market over long periods of time.  It seems unfathomable that any of these companies could be poor investments going forward, but history suggests otherwise. That said, it’s also true that past performance isn’t a guarantee of future results, so we don’t know for sure what the future will bring. We do, though, think caution is warranted when assuming that today’s top performers will continue to be tomorrow’s top performers.

The solution to combat a concentrated portfolio of mega-cap stocks is simply to reduce position sizes and rebalance into a diversified market portfolio.  Multiple studies have shown that concentrated portfolios often underperform over long time periods, and the optimal portfolio decision is to rebalance and reduce volatility and exposure.3Nathan Sosner, “When Fortune Doesn’t Favor the Bold. Perils of Volatility for Wealth Growth and Preservation. The Journal of Wealth Management Winter 2022, jwm.2022.1.189; https://doi.org/10.3905/jwm.2022.1.189 4Bernt Arne Ødegard, “The diversification cost of large, concentrated equity stakes. How big is it? Is it justified?” Finance Research Letters Volume 6, Issue 2. https://doi.org/10.1016/j.frl.2009.01.003 5Baird’s Private Wealth Management Research, “The Hidden Cost of Holding a Concentrated Position. Why diversification can help to protect wealth.” https://www.bairdwealth.com/siteassets/pdfs/hidden-cost-holding-concentrated-position.pdf  If you or your clients have concentrated positions in any of the above companies, Exceed Investments can help. Exceed’s tools can be implemented to hedge large investments, and in many cases reduce them to a desired level, often without having to pay capital gains tax.  There are of course transaction costs involved, as well as advisory fees in the case of an options strategy, but the ability to exit these positions tax neutrally while also reducing portfolio volatility can have a substantial effect on long-term capital appreciation.


Contact us for a consultation.


IMPORTANT DISCLOSURE: The information in this blog is intended to be educational and does not constitute investment advice. Exceed Advisory offers investment advice only after entering into an advisory agreement and only after obtaining detailed information about the client’s individual needs and objectives. Hedging does not prevent all losses or guarantee positive returns. Transaction costs and advisory fees apply to all solutions implemented through Exceed.


Footer

Get in Touch

  • 79 Madison Avenue 3rd floor,
    New York, NY 10016
  • 646-580-7046

Legal

  • Privacy Policy
  • Terms and Conditions
  • Disclosures

Recent Posts

  • Box Spread Lending: A Tax-Efficient Way to Leverage Investment Portfolios
  • The Psychology of Waiting – Why Investors Delay Hedging Until It’s Too Late
  • Why Options Strategies Belong in Portfolios with Concentrated Positions

Copyright © 2025 · Exceed Investments · Web Design Services by JSMT Media