• Skip to primary navigation
  • Skip to main content
  • Skip to footer
Exceed Investments

Exceed Investments

Let us be your Options Expert

  • Why Exceed
  • Strategy Spotlight
  • Who We Are
  • Blog
  • Contact

tax loss harvesting

Tax Lessons Learned From Tesla

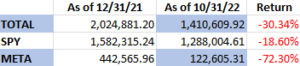
The past few years for Tesla (Ticker: TSLA) have been anything but mundane. Shares of the equity experienced a meteoric rise from mid-2019 to late 2022, with a trough-to-peak rally of over 3400% in a little over three years. However, after its parabolic ascent the shares declined by about 75% in a little over a year.


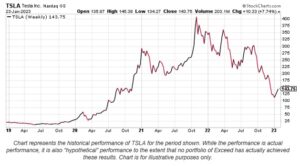
Opinions on the company are as polarizing as they come – some believe that it’s a cash-burning vortex destined for bankruptcy, while others are convinced Elon Musk can walk on water and TSLA is set to take over the world. Musk’s recent Twitter fiasco removed a lot of the sparkle from his image, and that shift in sentiment can be seen in Tesla’s recent performance.  There was always an embedded “Elon premium” in the shares, as believers shunned fundamentals because of the CEO’s rockstar image. Is it possible that there is now an “Elon discount?”

Early investors in the company experienced a financial windfall between mid-2019 and November 2021, but many were likely caught up in the hype, which would limit a potentially prudent taking of some profit. Aside from human emotions, the most likely reason that a buy-and-hold investor refused to reduce their TSLA position after its rapid rise was the associated tax liability with selling shares. Let’s look at a hypothetical situation involving an early investment in TSLA…

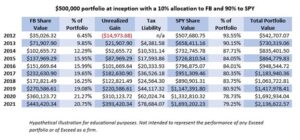
Assume a buy-and-hold investor with a $1M portfolio invested 10% of their capital in TSLA shares at an average price of $20 (split adjusted for today’s prices) at the end of 2018, and the remaining 90% of their capital was invested in a diversified market fund. For simplicity’s sake, in this example we’ll use the SPDR S&P 500 ETF trust (symbol SPY), an exchange traded fund (ETF) that aims to track performance of the S&P 500 index. So, on 1/2/2019 this hypothetical portfolio consisted of $100,000 in TSLA shares and $900,000 in SPY shares. The table below shows the performance of the Tesla and SPY positions, using end-of-year values. This illustration also assumes a 20% capital gains tax rate.


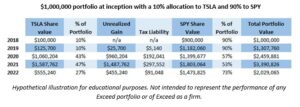
As you can see the Tesla position quickly grew into a substantial percentage of the total portfolio holdings. From the investor’s perspective, this is obviously a very good thing because it means that the TSLA position was appreciating rapidly. However, this rapid appreciation creates other problems associated with buy-and-hold investing.  Multiple studies have shown that holding a concentrated portfolio generally leads to underperformance. 1Nathan Sosner, “When Fortune Doesn’t Favor the Bold. Perils of Volatility for Wealth Growth and Preservation. ”The Journal of Wealth Management Winter 2022, jwm.2022.1.189; DOI: https://doi.org/10.3905/jwm.2022.1.189  2Bernt Arne Ødegard, “The diversification cost of large, concentrated equity stakes. How big is it? Is it justified?” Finance Research Letters Volume 6, Issue 2. https://doi.org/10.1016/j.frl.2009.01.003 3Baird’s Private Wealth Management Research, “The Hidden Cost of Holding a Concentrated Position. Why diversification can help to protect wealth.” https://www.bairdwealth.com/siteassets/pdfs/hidden-cost-holding-concentrated-position.pdf

In addition to the heavy concentration risk, the total portfolio volatility grew substantially. TSLA has a five-year monthly beta of 2.03, meaning that it’s more than twice as volatile as “The market.” As a result, total portfolio volatility grew by nearly 50 percent over the first three years. Elevated levels of volatility that lead to underperformance can be detrimental to risk-adjusted performance metrics like Sharpe and Sortino Ratios.

It’s easy to look back and wonder why an investor didn’t rebalance their portfolio after such a gigantic move higher by TSLA, but hindsight is always 20/20. At its peak at the end of 2021, the theoretical tax liability associated with the TSLA holding was approximately three times the initial investment amount, and nearly 30% of the initial portfolio value! Upon the liquidation of shares, this tax liability can be seen as an immediate loss of portfolio value.

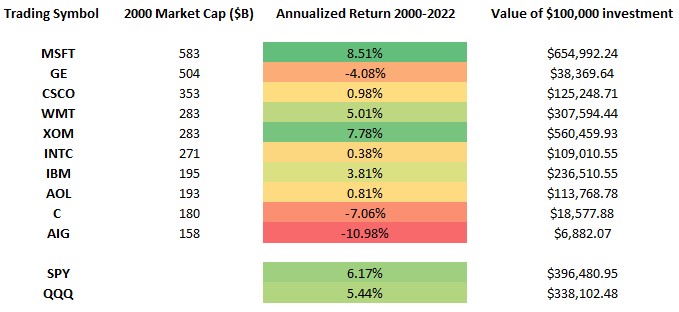
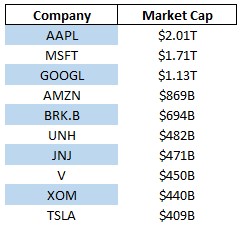
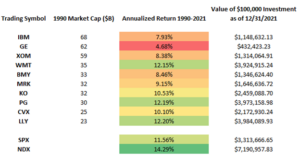
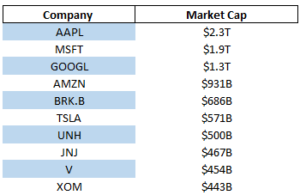
Rapid ascents by companies like this aren’t anything new. History is littered with similar examples of companies that quickly rose to prominence, only to fall back to earth. A few that immediately come to mind are Yahoo, Dell Computer, Zoom, Meta, Netflix, Nokia, and Blockbuster Video. Generally speaking, companies that rise the most during bull markets may depreciate rapidly during market downturns. It’s imperative that investors harvest gains and periodically rebalance their portfolios in order to avoid substantial drawdowns.

The good news is that there are solutions to these common problems. Options are often (and rightly) viewed in a negative light among retail investors, as they can be very risky and lead to substantial losses. Options are complex and can be intimidating to even the most seasoned investor. What many people don’t realize, though, is that options can also be powerful tools for tax optimization and hedging within a portfolio. When correctly implemented, an option overlay strategy may completely eliminate tax liability on certain concentrated positions, while simultaneously hedging downside risk. There are of course transaction costs involved, as well as advisory fees in the case of an overlay strategy, but the ability to exit these positions tax neutrally while also reducing portfolio volatility can have a substantial positive effect on long-term capital appreciation.

If you or a client are dealing with how best to address the tax liability and downside risk concerns that often accompany concentrated positions, feel free to reach out to the team at Exceed Investments. Members of Exceed’s Portfolio Management Team have over 38 years of professional options experience and are well-versed in the tax code. These strategies can be tailored to fit specific investment goals and satisfy immediate needs. When executed properly, these option overlay strategies may reduce or eliminate tax liability, lower risk, and help you and your clients achieve their financial goals in an efficient manner.


Contact us for a consultation.


This blog post is for informational or educational purposes only and is not intended as investment advice.  Any discussion of investment strategy or approach is intended only to illustrate investment concepts and in no case does the discussion represent Exceed Advisory’s investment performance or the results of any Exceed Advisory portfolio.  We provide investment advice only to clients and only after entering into an advisory agreement and obtaining information concerning individual needs and objectives. We think the information provided is accurate, but accuracy is not guaranteed. All investing in securities involves risks, including the risk of loss.


Where Are Those “Top 10” Companies Now? – “Millennium” Focus

“Top” companies can seemingly do no wrong during their ascent. Whether filtered by top US companies by market cap or fastest growing over the last decade, these companies tend to be household names with a ton of caché. Right now, the top US company by market cap is Apple (AAPL). The fastest growing for the last decade (2010s) is Netflix (NFLX). Some of the luster has already caught up to Netflix as competitors have filled the gap. Apple, though, still seems to dominate. Will that be the case in five years? 10 years? When a fifty-something is ready to retire and dip into their nest-egg?

The only sure thing in investing is uncertainty, but maybe we can learn something from history. How have the “Apples” and “Netflixes” of the past performed over time? Today, let’s look back to 2000 and see if there are any important lessons for investors.

Below is a list of the ten largest companies by market capitalization as of the start of 20001As of the close of trading on 12/31/1999, and their performance since. These return numbers include dividend reinvestment and consider a hypothetical $100,000 investment in each security on the close of trading for 19992As of the close of trading on 12/31/1999. The ending value is as of 12/31/2022. We’ve also provided information on the results of the SPDR S&P 500 ETF Trust (SPY), representing large-cap US equities, and the Invesco QQQ Trust (QQQ), an ETF with holdings of mostly large-cap stocks from the Nasdaq 100, during the same period. While it’s not possible to invest directly in an index, index returns are widely used to reflect the performance of “markets” overall.


The hypothetical performance shown in the table above is for illustrative purposes only and is not intended to represent the performance of any Exceed Advisory portfolio or of Exceed as a firm.


This decade was an especially difficult time in markets, as the tech bubble burst in 2000 and led to a catastrophic selloff in equities over the next two years.  Markets recovered and recouped most of the losses from the tech bubble over the subsequent five years, but that rally led right into the financial crisis of 2008. Stocks fell precipitously once again before bottoming in early 2009, but this period was essentially a lost decade for investors. It’s evident from the table above that this era of investing was fraught with risk, as even the most established companies weren’t insulated from the crisis. Of the 10 largest companies by market capitalization in 2000, only investments in MSFT and XOM would’ve yielded returns in excess of market indices.  Of the other 8 companies on this list that underperformed the broad market, only two generated dollar returns of at least half of that of a similar investment in SPY.  Investments in three of these companies (AIG, C, and GE) would’ve resulted in significant capital losses over this twenty-two-year period.  Market crises create the potential for big losses in individual names, and this period was no exception. It’s especially important to have a diversified portfolio during such times, and history will likely repeat itself in the future on a long enough timeframe.

Below is the current list of the ten largest U.S. corporations. We will continue to look at different slices of time in future blogs as we did above, but the theme remains consistent – historically, most of the biggest companies have underperformed the broad market over long periods of time.  It seems unfathomable that any of these companies could be poor investments going forward, but history suggests otherwise. That said, it’s also true that past performance isn’t a guarantee of future results, so we don’t know for sure what the future will bring. We do, though, think caution is warranted when assuming that today’s top performers will continue to be tomorrow’s top performers.

The solution to combat a concentrated portfolio of mega-cap stocks is simply to reduce position sizes and rebalance into a diversified market portfolio.  Multiple studies have shown that concentrated portfolios often underperform over long time periods, and the optimal portfolio decision is to rebalance and reduce volatility and exposure.3Nathan Sosner, “When Fortune Doesn’t Favor the Bold. Perils of Volatility for Wealth Growth and Preservation. The Journal of Wealth Management Winter 2022, jwm.2022.1.189; https://doi.org/10.3905/jwm.2022.1.189 4Bernt Arne Ødegard, “The diversification cost of large, concentrated equity stakes. How big is it? Is it justified?” Finance Research Letters Volume 6, Issue 2. https://doi.org/10.1016/j.frl.2009.01.003 5Baird’s Private Wealth Management Research, “The Hidden Cost of Holding a Concentrated Position. Why diversification can help to protect wealth.” https://www.bairdwealth.com/siteassets/pdfs/hidden-cost-holding-concentrated-position.pdf  If you or your clients have concentrated positions in any of the above companies, Exceed Investments can help. Exceed’s tools can be implemented to hedge large investments, and in many cases reduce them to a desired level, often without having to pay capital gains tax.  There are of course transaction costs involved, as well as advisory fees in the case of an options strategy, but the ability to exit these positions tax neutrally while also reducing portfolio volatility can have a substantial effect on long-term capital appreciation.


Contact us for a consultation.


IMPORTANT DISCLOSURE: The information in this blog is intended to be educational and does not constitute investment advice. Exceed Advisory offers investment advice only after entering into an advisory agreement and only after obtaining detailed information about the client’s individual needs and objectives. Hedging does not prevent all losses or guarantee positive returns. Transaction costs and advisory fees apply to all solutions implemented through Exceed.


Where Are Those “Top 10” Companies Now? – “Nineties” Focus

“Top” companies can seemingly do no wrong during their ascent. Whether filtered by top US companies by market cap or fastest growing over the last decade, these companies tend to be household names with a ton of caché. Right now, the top US company by market cap is Apple (AAPL). The fastest growing for the last decade (2010s) is Netflix (NFLX). Some of the luster has already caught up to Netflix as competitors have filled the gap. Apple, though, still seems to dominate. Will that be the case in five years? 10 years? When a fifty-something is ready to retire and dip into their nest-egg?

The only sure thing in investing is uncertainty, but maybe we can learn something from history. How have the “Apples” and “Netflixes” of the past performed over time? Today, let’s look back to 1990 and see if there are any important lessons for investors.

Below is a list of the ten largest companies by market capitalization as of the start of 1990[1], and their performance since. These return numbers include dividend reinvestment and consider a hypothetical $100,000 investment in each security on the close of trading for 1989[2].  The ending value is as of 12/31/2021. We’ve also provided information on the results of the S&P 500 Index (SPX), representing large-cap US equities, and the Nasdaq 100 Index (NDX), representing the 100 largest non-financial companies listed on the Nasdaq stock exchange, during the same period. While it’s not possible to invest directly in an index, index returns are widely used to reflect the performance of “markets” overall.

[1] As of the close of trading on 12/29/1989

[2] As of the close of trading on 12/29/1989

The hypothetical performance shown in the table above is for illustrative purposes only and is not intended to represent the performance of any Exceed Advisory portfolio or of Exceed as a firm.


What’s immediately evident is the underperformance by most of these companies versus the broad market.  Only three of these ten stocks outperformed the S&P 500 over this 32-year period and the level of outperformance was very modest.  Of the seven companies that underperformed the market during this time, only CVX and KO were able to produce dollar returns of at least half of what a similar hypothetical investment in the S&P 500 index would have produced.  Annualized returns of only a few percent below the market may not seem like much on the surface, but the differences can be staggering when compounded over multiple decades.

Exxon Mobil Corp (XOM) is the only company on the list from 1990 that is also on today’s top-ten list. The oil giant is currently the tenth-largest U.S. company, with a market capitalization of about $443B.  After underperforming for years, shares of XOM doubled from early 2020 to the end of 2021. The rally has continued this year as the Russia-Ukraine conflict rages on and puts upward pressure on energy prices.  The pending global economic slowdown could potentially bring energy prices and equities under pressure, and any resolution or de-armament between Russia and Ukraine would likely lead to easing energy prices across the board. There are currently multiple risk factors that could reduce investment demand in XOM and bring its share price and market capitalization back closer to longer-term equilibrium levels.

So why did most of the largest ten companies underperform the broad market over this period? There’s obviously no explicit or simple answer, though multiple hypotheses may make a case for market efficiency.  Perhaps this phenomenon is just the result of the dreaded “Law of large numbers.” Companies that achieve a certain size and level of market dominance eventually are capped by macroeconomic factors, and their growth rates normalize.  The ten companies listed above weren’t built on fads or short-term economic trends, but many from the 2000s and 2010s were. Perhaps investors gravitated toward the newer “sexy” investments and shunned these present-day value names in hopes of achieving outsized returns.  Economic trends have always been cyclical, and this creates boom and bust periods where a deemed great investment multiple years ago can become the exact place where you do not want to be invested when the tide goes out.

Below is the current list of the ten largest U.S. corporations. We will continue to look at different slices of time in future blogs as we did above, but the theme remains consistent – historically, most of the biggest companies have underperformed the broad market over long periods of time.  It seems unfathomable that any of these companies could be poor investments going forward, but history suggests otherwise. That said, it’s also true that past performance isn’t a guarantee of future results, so we don’t know for sure what the future will bring. We do, though, think caution is warranted when assuming that today’s top performers will continue to be tomorrow’s top performers.


The solution to combat a concentrated portfolio of mega-cap stocks is simply to reduce position sizes and rebalance into a diversified market portfolio.  Multiple studies have shown that concentrated portfolios often underperform over long time periods, and the optimal portfolio decision is to rebalance and reduce volatility and exposure.[3],[4],[5] If you or your clients have concentrated positions in any of the above companies, Exceed Investments can help. When executed properly, Exceed’s option tools can be implemented to hedge large investments, and in many cases reduce them to a desired level, often without having to pay capital gains tax. There are of course transaction costs involved, as well as advisory fees in the case of an options strategy, but the ability to exit these positions tax neutrally while also reducing portfolio volatility can have a substantial effect on long-term capital appreciation.

Contact us for a consultation.


IMPORTANT DISCLOSURE: The information in this blog is intended to be educational and does not constitute investment advice. Exceed Advisory offers investment advice only after entering into an advisory agreement and only after obtaining detailed information about the client’s individual needs and objectives.


[3] Nathan Sosner, “When Fortune Doesn’t Favor the Bold. Perils of Volatility for Wealth Growth and Preservation. The Journal of Wealth Management Winter 2022, jwm.2022.1.189; https://doi.org/10.3905/jwm.2022.1.189

[4] Bernt Arne Ødegard, “The diversification cost of large, concentrated equity stakes. How big is it? Is it justified?” Finance Research Letters Volume 6, Issue 2. https://doi.org/10.1016/j.frl.2009.01.003

[5] Baird’s Private Wealth Management Research, “The Hidden Cost of Holding a Concentrated Position. Why diversification can help to protect wealth.”  https://www.bairdwealth.com/siteassets/pdfs/hidden-cost-holding-concentrated-position.pdf

Tax Avoidance Gone Wrong – The Rise and Fall of Facebook

Facebook’s IPO was one of the hottest ever.  The company was growing at an astounding rate as social media went fully mainstream, and everyone wanted in on the action. Facebook went public on May 12, 2012 at $38 per share, and after some initial weakness the stock price experienced a meteoric rise over the next nine years. Despite FB declining more than 50% in the months immediately following its initial offering, a buy-and-hold investor who purchased shares on the day of its IPO saw a return of 10 times their initial investment between 2012 and 2021.

Fast forward to present day and the situation looks much different for holders of Facebook (now Meta) shares. Increasing competition from TikTok, government regulation, market saturation, and a deteriorating macroeconomic environment have led to a 75% peak-to-trough decline over the past thirteen months. The paper gain that existed for these IPO investors wilted from 900% to less than 150% in the span of a little over a year. Life comes at you fast.

It’s easy to look back and wonder why someone holding a concentrated position in Facebook shares didn’t sell or at least reduce their position after such a big rally, but there are monetary and psychological reasons why investors struggle to dispose of appreciated assets. Human emotions and greed aside, the primary reason investors hesitate to sell stock after a big gain is capital gains tax. Let’s take a look at the math by illustrating a hypothetical investment in FB shares on its initial public offering…

Assume an investor allocated 10% of their $500,000 portfolio to FB shares at the IPO price of $38, and the remaining 90% of their capital was invested in a diversified market fund. For simplicity’s sake, in this example we’ll use the SPDR S&P 500 ETF trust (symbol SPY), an exchange traded fund (ETF) that aims to track performance of the S&P 500 index. So, on 5/18/12 this hypothetical e-portfolio consisted of $50,000 in FB shares and $450,000 in SPY shares. The table below shows the performance of the Facebook and SPY positions, using end-of-year values. This illustration also assumes a 20% capital gains tax rate.


As you can see the Facebook position quickly grew into a substantial percentage of the total portfolio holdings. While this is obviously a good thing, it creates a myriad of other problems that can arise in buy-and-hold investing. Portfolios with concentrated positions are a recipe for underperformance. Studies have shown that not only do concentrated positions raise the overall risk and volatility profile of a portfolio, but historically those portfolios have also exhibited suboptimal returns.¹ Heavy concentration in a single-stock position creates the potential for catastrophic losses, which can take many years to recoup. Lastly, managing a concentrated portfolio is more difficult than simply rebalancing a “standard” diversified portfolio of stocks and bonds.

Below are the 2022 returns and position values for the hypothetical portfolio described above.  You’ll notice that the portfolio is underperforming the S&P 500 by over 11% this year, and this can be attributed solely to the concentrated position in META shares. Adding insult to injury, the equity underperformed the broad market over virtually every timeframe this year, and at an elevated level of volatility. META has a five-year monthly beta of 1.32, compared to a market beta of one. Not only did shares of META underperform the market on a gross basis, but even more so on a risk-adjusted basis. Poor returns by assets with higher risk profiles can be detrimental to risk-adjusted performance metrics like Sharpe and Sortino Ratios.


So why didn’t our theoretical investor simply sell some shares to reduce risk? Most likely, they wanted to avoid paying a 20% capital gains tax. Based on a 20% capital gains rate, the theoretical taxes owed if the investor had liquidated the position at the end of 2021 were more than 150% of the initial investment and nearly 4% of the total portfolio value!  On the face of it, deferring this sale seems logical, as that tax can be seen as an immediate loss. However, calculations suggest that investors who choose to liquidate their concentrated positions and pay capital gains tax are making the optimal decision. Reducing volatility has a first-order effect on the long-run growth and preservation of wealth.¹

The good news is that there are solutions to these common problems. Options are often (and rightly) viewed in a negative light among retail investors, as they can be very risky and lead to substantial losses. Options are complex and can be intimidating to even the most seasoned investor. What many people don’t realize, though, is that options can also be powerful tools for tax optimization and hedging within a portfolio. When correctly implemented, an option overlay strategy may completely eliminate tax liability on certain concentrated positions, while simultaneously hedging downside risk. There are of course transaction costs involved, as well as advisory fees in the case of an overlay strategy, but the ability to exit these positions tax neutrally while also reducing portfolio volatility can have a substantial effect on long-term capital appreciation.

If you or a client are dealing with how best to address the tax liability and downside risk concerns that often accompany concentrated positions, feel free to reach out to the team at Exceed Investments. Members of Exceed’s Portfolio Management Team have over 38 years of professional options experience and are well-versed in the tax code. These strategies can be tailored to fit specific investment goals and satisfy immediate needs. When executed properly, these option overlay strategies can reduce or eliminate tax liability, lower risk, and help you and your clients achieve their financial goals in an efficient manner.


¹ Nathan Sosner, “When Fortune Doesn’t Favor the Bold. Perils of Volatility for Wealth Growth and Preservation. ”The Journal of Wealth Management Winter 2022, jwm.2022.1.189; DOI: https://doi.org/10.3905/jwm.2022.1.189


This blog post is for informational or educational purposes only and is not intended as investment advice.  Any discussion of investment strategy or approach is intended only to illustrate investment concepts and in no case does the discussion represent Exceed Advisory’s investment performance or the results of any Exceed Advisory portfolio.  We provide investment advice only to clients and only after entering into an advisory agreement and obtaining information concerning individual needs and objectives. We think the information provided is accurate but accuracy is not guaranteed. All investing in securities involves risks, including the risk of loss.

Footer

Get in Touch

  • 79 Madison Avenue 3rd floor,
    New York, NY 10016
  • 646-580-7046

Legal

  • Privacy Policy
  • Terms and Conditions
  • Disclosures

Recent Posts

  • Where are Those “Top 10” Companies Now? – “2010” Focus
  • You Made a Fortune in One Investment. Now What?
  • Can AI Search Destroy Google’s Value?

Copyright © 2023 · Exceed Investments · Web Design Services by JSMT Media